Monday, September 20, 2010

Project 1. REPORT

The aim of this week‘s project was to determine whether relationships exist between pollution and asthma hospitilization rates in the 9 counties of the San Francisco Bay Area, and thus where best to allocate pubic health funds in terms of staffing and supplies.  


Public Health Analysis. Part 1. Demographics
Part 1 focused on how many people lived in each county, where the largest numbers of uninsured people lived and whether there was a correlation between lack of insurance and indirect indicators of poverty (race and female-headed households). 


Public Health Analysis. Part 2. Take a closer look at Asthma
In Part 2 we looked at the relationship between asthma hospitilization rates, pollution and racial composition of the population.  As can be seen in the map below, the proportion of African Americans in a county was strongly correlated with the asthma hospitilization rates. 


Unfortunately I ran out of time to complete all the maps.  This was a somewhat frustrating week as the goalposts shifted in terms of deliverables.  However, I guess that happens with deliverables in the real world too.  Hopefully the coming projects will go more smoothly as we now have a better understanding of how this module will work. 


Wednesday, September 15, 2010

Tuesday, September 7, 2010

SAN FRANSCISCO BAY AREA.

PROJECT 1. Week 1. Asthma, Air pollution and Ethnicity. 

Links to Metadata
1. Asthma
2. Ozone
3. Particulate Matter
4. Race

Friday, July 23, 2010

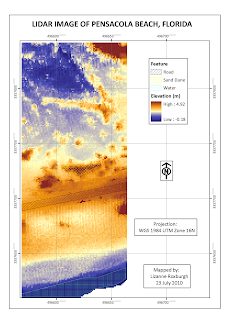
MODULE 5. LIDAR

Although I regret not being able to learn much more about using IMAGINE, it is a relief to be back in the more familiar environment of ARCGIS. And much faster too. This lab was straightforward and took half the estimated time to complete, rather than double.

Tuesday, July 20, 2010

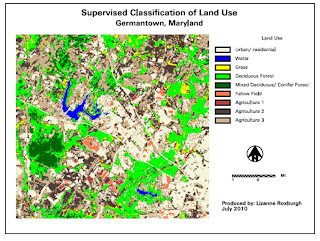
MODULE 4. Supervised Classification


After completing the supervised classification, I combined several classes to simplify the legend. I combined only two of the 4 agriculture classes as they had relatively different spectral signatures, but combined all the urban signatures as well as the fallow fields. Some of the roads seem to have been classified as agricultural land or fallow fields.

Link to xps file

Wednesday, July 14, 2010

MODULE 3. Rectification

Working with imagery is desperately slow on a remote desktop, which is a challenge in itself. I'm assuming its just my very sloooooowww connection here in Africa ....... So no bells and whistles in these labs, just the basics.


Link to map in xps format

Saturday, June 26, 2010

MODULE 1. Introduction to Erdas

Link to map in xps format

This was a straightforward lab. It seems that the map-making capabilities of Erdas Imagine are limited. I assume its strength lies elsewhere.

I tried to save the map as a pdf, but that caused Imagine to hang and I had to shut it down.