Wednesday, February 24, 2010

MODULE 6 CHOROPLETH MAPS

MAP 1. Percentage Population Change by State

I am still struggling with layers, but things are improving. I learnt how to proportionally constrain the size of a layer (other than by manual eyeballing), which is a useful skill. I had a few problems importing from ArcGIS, especially with regard to font and size. I think perhaps ArcGIS saves in an older version of AI. I had to redo some of the text in AI. Still a bit frustrating to work with AI, but I am beginning to see potential here.


MAP 2. Percentage Population Change by Division

I wanted to make the divisions visually clearer and non-ambiguous but I could not figure out how to overlay pattern upon colour or how to outline a division with a darker colour. But I don't think it is that important to know exactly which state is in which division so the slight ambiguity should not be a problem. Nevertheless it would be good to find this out in future.

Sunday, February 14, 2010

MODULE 5 MAP COMPOSITION

Uff. I sweated over this map. It took forever to figure out how to work with layers, and be able to move map elements around and resize them. Still lots to learn about using Illustrator. I had a lot of trouble with the colours and even though the possibilities are endless and it was fun playing with the colour wheel, in some ways I prefer this in Arc where you have a limited selection of options that work. The colours in this map need more work, but I have reached my time limit ...........

Monday, February 8, 2010

MODULE 4 TYPOGRAPHY

Our assignment this week was to correctly label a map of the central Florida Keys. This was also our first introduction to Abode Illustrator. AI looks like it is going to be great to work with, once we have figured it out.


I enjoyed using the Bauhaus font to label the National Park and City features, and I looked it up in Wikipedia. This font was based on Herbert Bayer's 1925 experimental Universal typeface. Who was Herbert Bayer? He was an Austrian graphic designer and artist and the last surviving member of Bauhaus. He died in 1985. He studied under Wassily Kandisky, and eventually ended up living in Aspen, Colorado. The Denver Art Museum apparently contains a large number of his works.

Tuesday, February 2, 2010

MODULE 3 DATA CLASSIFICATION

Our assignment for this week was to map the percentage of African Americans living in different parts of Escambia County, Florida, using different data classification methods, and to assess which classification method best represents the data.


Which classification best represents the data and why?

The data are positively skewed. Thus using the Equal Interval classification is not ideal, as most counties fall into the first two classes, with the last class having very few counties.

The distribution of data across Natural Break classes is also clumped, again with the first two classes containing most of the data. This would be the method of classification that I would probably avoid in general as it is not easily interpretable and is difficult to compare between maps.

Both Standard Deviation and Quantile classifications produce a more even distribution of data as there are approximately equal number of counties in each class. However, as the data are positively skewed, and thus not normally distributed, the Standard Deviation method would be best used if the data were normalized first.

I would thus choose the Quantile method as the best method of representation for this data set.


Sunday, January 17, 2010

MAP CRITIQUE

I was interested to look at how satellite imagery was used in the production of maps and whether I could find an example of a good and a bad map that used satellite imagery.

Airbus Crashes in New York River – 16 January 2009
It’s the one-year anniversary of this crash. This was an emotive story, especially for those who fly regularly and have in the backs of their minds the fear of a crash - the difference with this crash being that all passengers and crew survived. How did the news media deal with this in terms of displaying the flight route and crash site?

I found the following two maps, one taken from the BBC News website and the other taken from the Huffington Post website. I know it may be unfair to compare a map placed on a website by one of the largest global media corporations with that of a small local paper. But I think this example illustrates how, with a bit of effort, a very bad map can be turned into a good one.

BBC News Map

Link to the story and map:
http://news.bbc.co.uk/2/hi/americas/7833025.stm


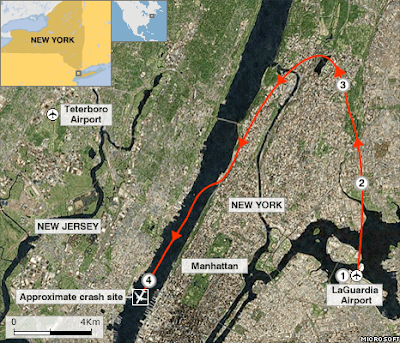
1 1526 local time (2026 GMT): Flight 1549 takes off from New York's LaGuardia Airport
2 1527 (2027 GMT): Pilot Chesley Sullenberger III reports birds hitting both engines and says he is returning to LaGuardia
3 1528 (2028 GMT): Plane banks to the left, but pilot decides he cannot reach LaGuardia or nearby Teterboro airport
4 1531 (2031 GMT): Pilot ditches plane in Hudson River


Good points about the map: the information is presented simply and clearly over the satellite image of the site, with the map placed in its geographical context in North America.


However, I assume that any cartographer looking at a map would have their own ideas of how to change or improve a map. In this map, I would include on the map itself some text about what happened at points 2 and 3.


Would the flight route have been better placed over a map of New York rather than a satellite image? I think the good thing about using imagery is that it is like a photograph and that a lot of what is displayed is understood intuitively, and does not require explanation. What strikes me about the image is that there is so little open space which could have been used to put that plane down safely. I don't think that would have come across as well using a map.


Huffington Post Map

Link to the story and map:
http://www.huffingtonpost.com/2009/01/15/hudson-river-plane-crash_n_158300.html


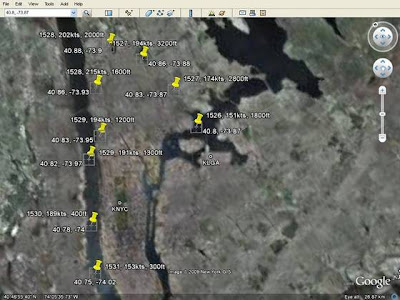
Why is it bad? In summary, lack of information and lack of summarizing what information was there for ease of comprehension by the viewer.

The image was not placed in a geographical context, so anyone not familiar with New York would have no idea where the crash happened.
No effort was made to indicate the direction of the flight, so that the viewer has to spend a few minutes working it out for themselves.
Joining the dots, or the place marks in this case, would have helped to show the flight rout more clearly.
KLGA and KNYC are incomprehensible labels for most people.
The cartographer (I use the term loosely here) did not bother to do more than a screen dump, and did not even make the effort to create a graphics file of the map alone.
The quality of the imagery used is very poor.
The GPS co-ordinates and altitude are surely of little or no interest to the general viewer and would constitute map crap, if there was anything else on the map.


HAITI EARTHQUAKE
Here's an interactive map, based on a satellite image, that shows the extent of damage in Port-au-Prince:
http://news.bbc.co.uk/2/hi/americas/8460787.stm

Wednesday, January 6, 2010

It's 2010 - year of the first ever World Cup in Africa. The noughties are over and we are into the teens. New Year's resolutions? Hmm ... losing those remaining pounds of baby fat and kicking my prolactin-addled brain into gear again with the UWF GIS course. Wish me luck!