Monday, March 29, 2010

MODULE 10 ISARITHMIC MAPPING


This was a fun lab to do and a good opportunity to learn some new skills in Illustrator. I used the Live Paint tool to fill in the colours between contours. Not neccessary for the lab, but nevertheless enjoyable and useful to know how to do. The opportunity to improve our skills using the pencil tool was also good.

Sunday, March 21, 2010

MODULE 9 FLOW MAPS


I chose the Eckert projection as I wanted to try a non-rectangular projection, and something a little different. I liked how the curved lines of longitude gave more of a sense of connectedness between the continents, and I thought that they complimented the curved arrows well. The placements of the North arrow and the scale bar had to be done carefully as these are only correct if positioned on the prime meridian and the equator respectively. In retrospect, I think the legend may be redundant. This map has been the most fun to put together so far.

Sunday, March 14, 2010

MODULE 8 DOT MAPS


This was the lab from hell. Several days and 2000+ dots later ..... I am struggling to complete the labs on time due to slow server speeds.

Monday, March 1, 2010

MODULE 7 PROPORTIONAL SYMBOL MAPS


Knowing that Germany has one of the highest alcohol consumption rates in Europe (being married to a German!) it immediately struck me that they were missing from the list we were given. A visit to the website revealed that they were in position number 3 behind France and Italy. And yep, I did miss that part about showing countries that were not wine consumers. I filled in all the missing data. I guess I won't get good grades for this map! But hopefully I'll get bonus points for verifying the data ??? :-)

Wednesday, February 24, 2010

MODULE 6 CHOROPLETH MAPS

MAP 1. Percentage Population Change by State

I am still struggling with layers, but things are improving. I learnt how to proportionally constrain the size of a layer (other than by manual eyeballing), which is a useful skill. I had a few problems importing from ArcGIS, especially with regard to font and size. I think perhaps ArcGIS saves in an older version of AI. I had to redo some of the text in AI. Still a bit frustrating to work with AI, but I am beginning to see potential here.


MAP 2. Percentage Population Change by Division

I wanted to make the divisions visually clearer and non-ambiguous but I could not figure out how to overlay pattern upon colour or how to outline a division with a darker colour. But I don't think it is that important to know exactly which state is in which division so the slight ambiguity should not be a problem. Nevertheless it would be good to find this out in future.

Sunday, February 14, 2010

MODULE 5 MAP COMPOSITION

Uff. I sweated over this map. It took forever to figure out how to work with layers, and be able to move map elements around and resize them. Still lots to learn about using Illustrator. I had a lot of trouble with the colours and even though the possibilities are endless and it was fun playing with the colour wheel, in some ways I prefer this in Arc where you have a limited selection of options that work. The colours in this map need more work, but I have reached my time limit ...........

Monday, February 8, 2010

MODULE 4 TYPOGRAPHY

Our assignment this week was to correctly label a map of the central Florida Keys. This was also our first introduction to Abode Illustrator. AI looks like it is going to be great to work with, once we have figured it out.


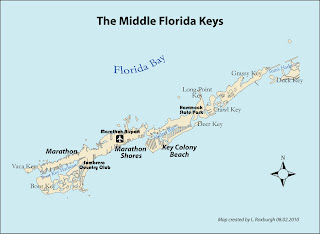
I enjoyed using the Bauhaus font to label the National Park and City features, and I looked it up in Wikipedia. This font was based on Herbert Bayer's 1925 experimental Universal typeface. Who was Herbert Bayer? He was an Austrian graphic designer and artist and the last surviving member of Bauhaus. He died in 1985. He studied under Wassily Kandisky, and eventually ended up living in Aspen, Colorado. The Denver Art Museum apparently contains a large number of his works.