Link to map in xps format
This was a straightforward lab. It seems that the map-making capabilities of Erdas Imagine are limited. I assume its strength lies elsewhere.
I tried to save the map as a pdf, but that caused Imagine to hang and I had to shut it down.
Saturday, June 26, 2010

Tuesday, April 27, 2010
FINAL PROJECT

The aggregate SAT scores and student participation rates for 2009 for college-bound seniors. The more students that take the exam in each state, the lower the average SAT score for that state. Therefore the College Board warns against using SAT scores to rank the quality of education in states.
Tuesday, April 6, 2010
MODULE 11 GOOGLE EARTH
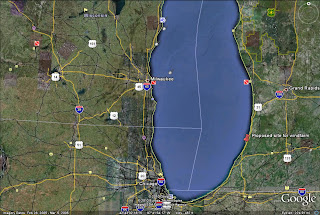
The site on the eastern side of Lake Michigan:
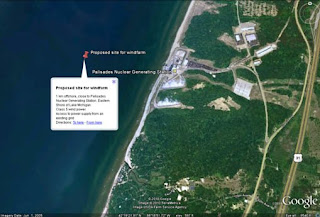
A close up of the site, with the annotated placemark:
Most onshore sites in the Great Lakes Region have wind speeds that are too low or marginal for wind power generation. Two regions that were most suitable based on wind speed data from the Wind Energy Resource Atlas were the Keenawah Peninsula, Isle Royale and offshore areas in Lake Superior and the eastern shores of Lake Michigan. These both had annual average wind power of at least 5. The Lake Superior site was too isolated and too far from where power was needed, in addition to which
a) wind turbine installations require power input for when the wind is not blowing and thus need to have access to a external power supply
b) Isle Royale is a National Park, and there are several other parks and forest reserves in the area, making a turbine installation undesirable from a landscape and visual impact perspective.

A close up of the site, with the annotated placemark:

Most onshore sites in the Great Lakes Region have wind speeds that are too low or marginal for wind power generation. Two regions that were most suitable based on wind speed data from the Wind Energy Resource Atlas were the Keenawah Peninsula, Isle Royale and offshore areas in Lake Superior and the eastern shores of Lake Michigan. These both had annual average wind power of at least 5. The Lake Superior site was too isolated and too far from where power was needed, in addition to which
a) wind turbine installations require power input for when the wind is not blowing and thus need to have access to a external power supply
b) Isle Royale is a National Park, and there are several other parks and forest reserves in the area, making a turbine installation undesirable from a landscape and visual impact perspective.
I thus chose an offshore site along the eastern shores of Lake Michigan as this has wind speeds sufficiently high for wind power generation all year round. The wind direction here is north-west to south-west. I chose a site close to a nuclear power station, as the power station could easily and cheaply supply the additional power needed by the turbines when they are not generating their own power. This has been done before in another nuclear power station in the US, and in fact, the turbines could be placed immediately around the power station onshore as an alternative site.
In terms of the other assessment criteria:
a) Ornithology. There could be a conflict with migration flyways, in particular the Mackenzie Valley-Great Lakes-Mississippi Valley Route, but this would need to be carefully assessed at a local scale to find out exact migration paths and heights.
b) Noise: a 300 m or more distance is required to reduce the noise to less than 35-40 dBa. The installation will be approximately 2 kms offshore.
c) Shadow flicker: a distance of 10 shadow diameters (400 to 800 m) is required to prevent shadow flicker. The installation is placed 2 kms offshore, so this will not be a problem.
d) Shipping: There is no conflict here with shipping lines. The main shipping lines are on the western side of Lake Michigan
e) Landscape and Visual Impact: A limit of at least 8 kms and up to 13 is recommended to minimize visual impact. The turbine installation would be approximately 8 kms from the nearest town, which is South Haven, so the visual impact will be minimal for the town. However, there are two parks in the vicinity of the nuclear power plant: Van Buren State Park to the North East and Covert Township Park to the south East. Possibly the parks were set up to create a buffer zone around the nuclear power plant, but the installation will have some visual impact on these two parks. The costs of placing the installation further offshore need to be assessed relative to the negative visual impacts. In addition, there are presumably building restrictions for the nuclear power plant, which will keep homes and other structures distant from the turbines, and the nuclear power plant itself already has visual impact in the area.
Monday, March 29, 2010
MODULE 10 ISARITHMIC MAPPING

This was a fun lab to do and a good opportunity to learn some new skills in Illustrator. I used the Live Paint tool to fill in the colours between contours. Not neccessary for the lab, but nevertheless enjoyable and useful to know how to do. The opportunity to improve our skills using the pencil tool was also good.
Sunday, March 21, 2010
MODULE 9 FLOW MAPS

I chose the Eckert projection as I wanted to try a non-rectangular projection, and something a little different. I liked how the curved lines of longitude gave more of a sense of connectedness between the continents, and I thought that they complimented the curved arrows well. The placements of the North arrow and the scale bar had to be done carefully as these are only correct if positioned on the prime meridian and the equator respectively. In retrospect, I think the legend may be redundant. This map has been the most fun to put together so far.
Sunday, March 14, 2010
MODULE 8 DOT MAPS

This was the lab from hell. Several days and 2000+ dots later ..... I am struggling to complete the labs on time due to slow server speeds.
Monday, March 1, 2010
MODULE 7 PROPORTIONAL SYMBOL MAPS

Knowing that Germany has one of the highest alcohol consumption rates in Europe (being married to a German!) it immediately struck me that they were missing from the list we were given. A visit to the website revealed that they were in position number 3 behind France and Italy. And yep, I did miss that part about showing countries that were not wine consumers. I filled in all the missing data. I guess I won't get good grades for this map! But hopefully I'll get bonus points for verifying the data ??? :-)
Subscribe to:
Posts (Atom)